The Greek vote and the political circumstances that influenced it – A timeline covering the past four decades
Historical data reveals how the Greek vote has changed since the political transition after the dictatorship, from the first parliamentary elections in 1974 to the most recent national elections in 2015.
Since the fall of the junta until today, the 2019 parliamentary elections – snap elections indeed, but, following (in comparison to the recent past), a relatively long governmental term – the Greeks have gone to the national polls a total of 17 times, not including the much-debated referendum on July 5, 2015 and the historic referendum on December 8, 1974 which marked a regime change.
Over a total period of 41 years, nearly half of these 17 elections have been held over the past 15 years, from 2000 on. It is during this time that, in general, the country has gone from four-party and five-party parliamentary representation to the recent eight-party parliament.
The collection of historical data and the analysis of the electoral result over time serve the narrative of the history of the Greek vote, which includes bipartisanship, all-party coalition government, political stability (as the product of some real or non-existent prosperity), parliamentary unrest, a flirtation with neo-Nazism and fragmented party strength.
When austerity shakes up the ballot box
In May 2012, for the first time in Greece, parliamentary elections are held during the bailout program and the voters’ “popular mandate” elects seven parties to parliament – the last time parliament was comprised of numerous parties was only in 1977, when citizens voted for the second time following the dictatorship. Three elections later, in September 2015, the number of parties represented in parliament rose to eight, forming a Greek Parliament comprised of the most parties in history since the political transition in 1974.
Earlier in history, parliament was usually made up of four or five parties, with a landmark year in 1989, when two elections were held in a climate of deep polarization, in the midst of the Koskota scandal – which shocked the political world and, of course, tested the relationship between political power and the press.
Indeed, after the first elections of that year, in June 1989, a consensus government under Tzannis Tzannetakis was formed, sealing the “historic compromise” between New Democracy and the Left. This government then led the country to the second elections of 1989, in November, which resulted in the “all-party coalition government” under Xenophon Zolotas. In the meantime, and in the years which followed, the opposing rhetoric of the “Scandalous ‘89” and the “Purification” continued to cross swords.
Number of parties in Parliament per election
The highest number of parties in history were elected to Parliament in September 2015.
Today, it is now clear that the “Transition of 1974” is not a single, continuous period: “The issue of the periodization of the Transition is open to different interpretations in the academic community. There is debate whether the policy of the “History of the Transition” should be viewed through the narrow lens of political competition or in the wider perspective of broad changes on the international scene,” Fani Kountouri, Assistant Professor (Department of Political Science and History) at Panteion University, states.
Professor Kountouri continues: “The beginning of the Transition in 1974 was marked by the change of government into a presidential parliamentary democracy. After this, the timeline varies: For some analysts, a first time period goes to 1989 when we were led to the so-called “historic compromise” within the framework of the collapse of existing socialism. Other analysts maintain that this period extends to 1996, when elections were held without Konstantinos Mitsotakis and Andreas Papandreou, the political leaders who marked the early years of the Transition. The later period of the Transition goes to 2010 with the signing of the first bailout program, and we’d say it ends with the 2012 elections which created an “electoral earthquake” that brought about a significant liquidation of the political landscape. In the 2012 elections, some very basic features of the Transition were altered − such as the rotation of power between two political parties (bipartisanship), one-party governments, voter divergence, and the emergence of new parties. At the same time, there are some qualitative differences, such as new forms of protest, very low voter confidence rates in parties and politicians, and new forms of self-organization.”
From the bipartisanship of 86.66% to “bipartisanship” without autonomy
The number of parties occupying seats in parliament, among other things, depends on the levels of bipartisanship, considering that when the electorate is compressed into two major political parties, the electoral rates of bipartisanship are high and, therefore, the strength of the remaining parties shrinks, along with their parliamentary representation.
A typical example is PASOK’s historic election victory (48.97%) in 1981, when New Democracy won 35.87% of the votes, and thus the sum of the first two parties reached 83.94%, which led to the historic low rate of a three-party parliament.
Regarding the question of whether 1981, the year of the “Change”, marked the beginning of bipartisanship, Professor Kountouri replies: “Bipartisanship began earlier in the 1977 elections when PASOK received 25.34%, compared to New Democracy’s 41.84%. However, in the 1981 elections there was a major overthrow: PASOK won, ND ‘fell’ and KKE gained 10.93%. Therefore, we have the allocation of parliamentary seats between the three parties. Indeed, the percentage of bipartisanship will later reach 86.66% in 1985. Bipartisanship maintains high percentages and slightly declines in the 1996, 2007 and 2009 elections −in all three of these elections, we finally have a five-party parliament.”
The total shares of the first two parties (%) per election
The median electoral rate of bipartisanship is 81.68%. Significantly below this, the Greek vote progresses from 2012 onwards.
In 2012, there was a collapse of bipartisanship as the Greeks knew it until then: New Democracy, the strongest parliamentary power, dropped to 29.66%, PASOK plummeted to a limited 12.28%, and SYRIZA relished an upward swing of 26.89%. Since then, a debate on “new bipartisanship” began and continues, which, however, finds its sum percentages far below the historical average.
“In this case, there is a greater chance for smaller political parties to rise. Here, however, we have to note that, after the signing of the first bailout program, there were some significant dismissals, withdrawals, the reshuffling of MPs − mainly in PASOK and New Democracy, some of which constituted new political formations,” comments Professor Kountouri.
The triumph of SYRIZA: a mirror image of PASOK’s collapse?
SYRIZA, which recorded its lowest percentage (3.2%) in 2000, (which at the time, was known as Synaspismos – the “Coalition of the Left and Progressives”) moved slightly upwards over the next few years, and enjoyed a swift increase in May 2012 and became a major force in January 2015, with 36.34%.
Conversely, PASOK followed a different course, and reached the lowest point (4.68%) in its history. “These are reversals that are created when the appropriate political opportunities are ‘ripe’ – in this specific case, the country’s entry into the bailout program brought about such political and social upheaval that the voter’s relationship to politics and political parties was redefined. SYRIZA, created in 2004 but carrying with it a large part of the active Left, prompted an early government takeover by the Left and managed to rally votes – mainly from PASOK, which, in essence, had collapsed. SYRIZA, in the context of the era, managed to formulate a social agenda and cultivate the hope of overthrowing a static situation. I would not say it is a reflection. The two phenomena develop in parallel; one is fueled by the fall of the other, but we must respect the autonomy of each subject separately,” affirms Professor Kountouri.
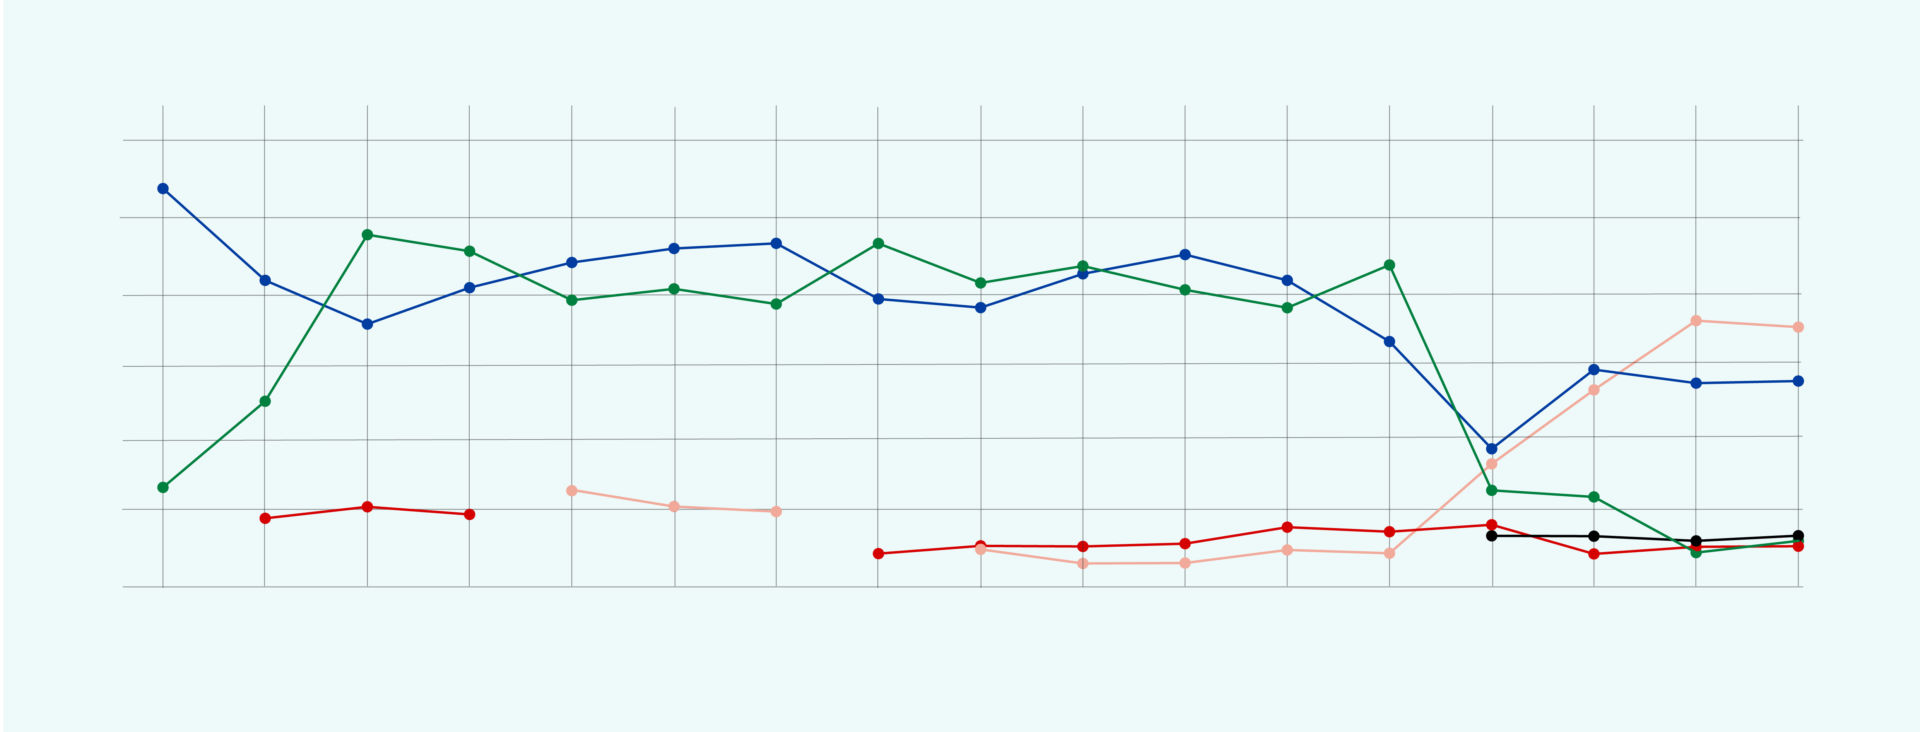
Electoral party percentages (%) per electoral round
The former government powers collapse during the “bailout program” years
Note: Only parties that are represented in Parliament over time are included, such as Golden Dawn, which is an important “addition” to parliamentary affairs. In the diagram, the parties are listed by their percentages in the last national elections, September 2015. Source: Hellenic Parliament
The Golden Dawn “phenomenon”
Golden Dawn received 6.97% and 6.92% of the votes in May and June 2012, respectively. This is the first time that the neo-Nazi party occupied seats in the Greek Parliament.
Nearly three years later, in January 2015, Golden Dawn’s percentage dropped to 6.28%, and it lost just one seat in parliament, which it regained in September 2015, when it reached its highest (6.99%), maintaining its traditionally high percentages in Lakonia and increasing its share of the votes among the Aegean islands, as the refugee crisis was in full swing.
“This is a complex phenomenon. By reading the experts (Vassiliki Georgiadou, The Far Right in Greece, 1965-2018, Kastaniotis, 2019), one understands that it is not a product of a perfect storm, but has deeper roots in Greek society and is present in the post-junta political scene, (National Alignment, a nationalist-conservative political party; and the National Political Union, a far-right political party) or in smaller parties,” reports Professor Kountouri, adding, “However, the understanding of Golden Dawn today, and its possible lower percentage in the upcoming elections, is closely linked to the fact that Golden Dawn has now been officially characterized as a criminal organization − it’s not just another far-right organization.”
The geographical distribution of the vote in favor of Golden Dawn in the last four elections
September 2015: Lakonia votes for Golden Dawn by 11.44%, the party increases its percentages in Northern Greece and the Aegean. Source: Ministry of the Interior.January 2015: In Lakonia, Golden Dawn gains 10.47% – Heraklion and Lasithi in Crete do not “send” GD to Parliament. Source: Ministry of the Interior.June 2012: The smallest percentage is recorded in Lasithi, Crete (2.59%). Source: Ministry of the Interior.May 2012: Golden Dawn achieves its highest percentage in Corinth (11.98%). Source: Ministry of the Interior.
Tools & Methodology
Collection and analysis of data are from source material. Data collection was facilitated using Python / Beautiful Soup. Python / Pandas was used for data analysis and data visualization. QJIS was used for mapping needs. Illustrator was used for the final editing of the diagrams. The code is available here.